Projects Dashboard
Projects Dashboard collates information from across WorkflowMax and presents it in a meaningful way.
The reporting capabilities of WorkflowMax are limited. Projects Dashboard provides a range of additional reports and charts to help you better understand your projects.
One of the most important aspects of managing projects is to ensure that they are delivered on time and on budget. Projects Dashboard provides a range of tools to help you track project progress and identify potential issues before they become a problem.
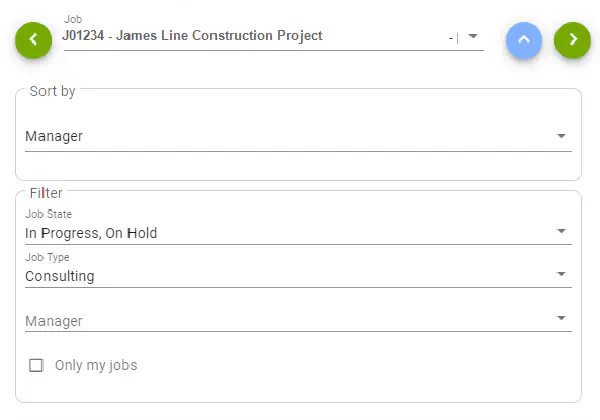
Job Navigation
Use the job navigator to step through jobs and quickly view each job in detail.
The job navigator includes a range of sorting and filtering options to help you find the jobs you are looking for.
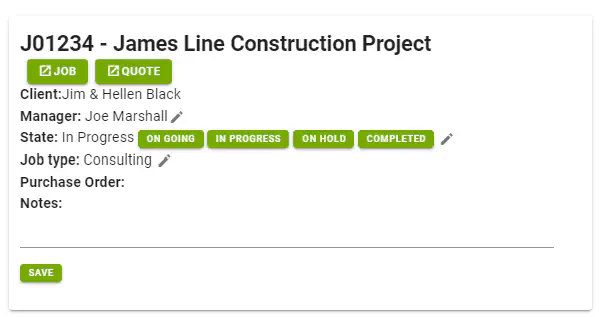
Job Information
See at a glance all the important details about a job, including: the Client, Project Manager, Current Job Status, Job Type and purchase order number.
In addition, any custom fields that have been added to the job can optionally be displayed here.
Job details can be edited directly from the dashboard without needing to go back into WorkFlowMax.
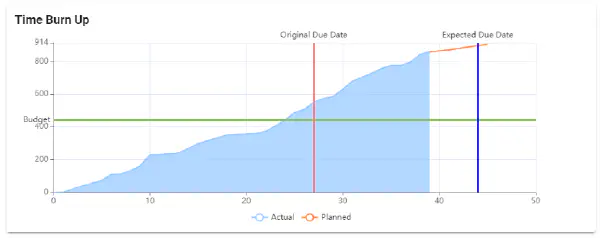
Burn up charts
Burn up charts show the amount of work completed (or “burned up”) against the total scope of a project. Burn up charts are an effective tool for tracking project progress, understanding team velocity, and forecasting project completion based on the current rate of progress.
The X-axis represents time, while the Y-axis represents the amount of work. Burn up charts are often used as part of agile software development methodologies like Scrum.
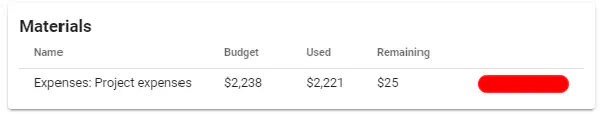
Costs & Materials
See how project material costs are tracking. View the the budgeted and actual costs as well as the difference.
Materials are broken down into WorkflowMax cost categories.
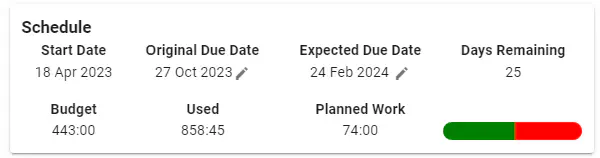
Schedule
See how the project is tracking against schedule, both in terms of calendar days as well as work hours.
If a project due date needs to be updated, this can be done at the click of a button, while maintaining the original due date for reporting purposes.
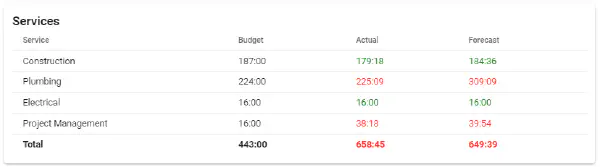
Services
Services are sections of your business. For example a construction company might have services for: Electrical, Plumbing, Carpentry, etc. Track how much time is being spent on each service to see how projects are tracking and which services are running under or over budget.
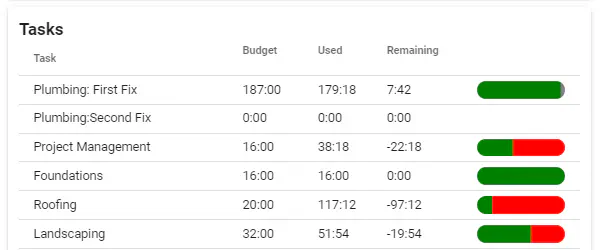
Tasks
Get a task-by-task breakdown of the project. See how much time has been spent on each task, how much time is remaining, and how much time was budgeted for each task.
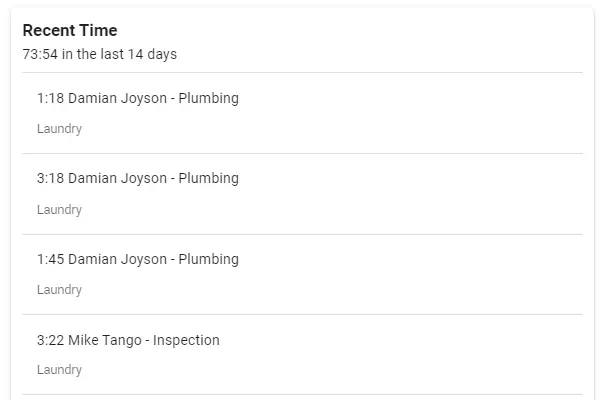
Time
Keep track of what your team has been working on by viewing the most recent time entries for the project.
Get in touch

We are here to help you with your WorkflowMax needs. Let's talk about how you can help you best utilise WorkflowMax or BetaWorkflow in your business.